
A farm nutrient review has identified opportunities for Grasslands Farming Ltd to reduce bought-in fertiliser and greenhouse gas (GHG) emissions, while improving grassland productivity and efficiency.
Joining the UK Dairy Carbon Network (UK-DCN) has enabled Grasslands Farming to further explore the efficiency of the extensive grazing system at Marl Heath Farm in Macclesfield, Cheshire.
As part of the UK-DCN project, the farm is focusing on enhanced nutrient management and more efficient fertiliser use. These form two of three GHG reduction strategies selected by the business with guidance from field experts and Farm Liaison Officer Kelly Seaton.
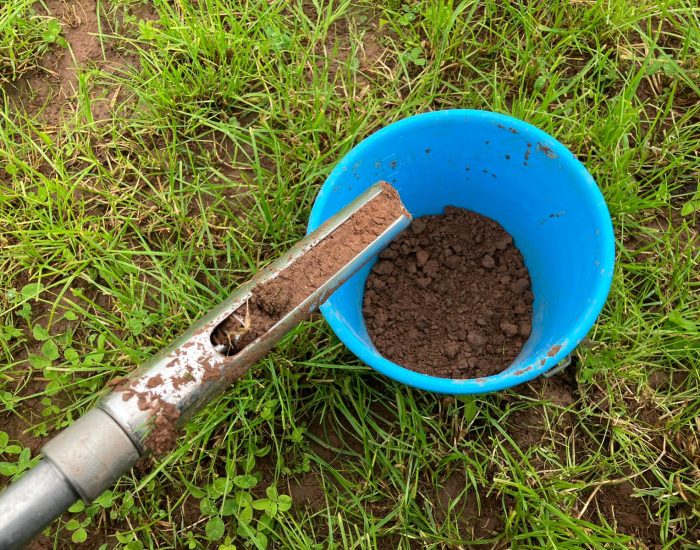
The priority was to establish a baseline for the milking platform. Soil samples were taken from the 12 fields making up the main grazing platform, which also contribute to the farm’s silage production. In addition, three slurry samples were collected during the spreading season.
Mark Tripney, soil and nutrient management consultant at ISoils, analysed the results to build a detailed nutrient review and field-level recommendations.
Soil pH and lime
Productive grassland performs best at pH 6.3-6.5. All sampled fields were below this optimum, although most were only slightly lower and only two recorded pH values below 6.0.
Mark stresses that correction should not focus on pH alone. “A soil can have an optimum calcium result and still have a low pH because another cation – a positively charged ion – like potash or magnesium is deficient,” he explains.
Most fields were well supplied with calcium, against a target base saturation (BS) of 65-70%. Magnesium was also close to its 10-12% target, although TJs, Roadside, Front Pasture and Henbury Bank were low (Table 1 below provides an analysis of all fields).
Mark recommended 300kg/ha of high-quality granulated lime where pH was slightly low and calcium remained within the target range, rising to 400kg/ha where greater correction was needed.
The lime product should also reflect the balance of calcium and magnesium. “TJs field showed a magnesium requirement, so magnesium limestone would be more suitable,” he adds.
Soil texture and nutrient retention
Cation Exchange Capacity (CEC) indicates how well soil retains nutrients and is influenced by texture. The farm’s values of 11-17.4 reflected its sandy loam to sandy silty loam soils.
“Lighter, sandy soils have a lower CEC and are more prone to leaching than heavier clay soils,” says Mark. “We cannot change this because soil texture cannot be altered.”
Soil organic matter (SOM) ranged from 5.6% to 8.2%, which Mark says is typical for grassland soils of this type. Maintaining good SOM levels supports soil structure and nutrient reserves, but excessive levels can cause problems.
“A high or rapidly rising SOM level can signal compaction and restricted nutrient cycling caused by poor aeration,” he explains.
Field requirements
Potash (K) levels varied across the grazing platform. TJs, Front Pasture Bottom and the Pinch fields recorded lower K concentrations, while the remaining fields had higher K concentrations (see Table 1 below).
Phosphate (P) was adequate across all sampled fields, so further slurry or fertiliser applications should be carefully targeted. High K can compromise magnesium availability to livestock, while excess P can reduce copper and zinc availability.
Sulphur (SO₃) was deficient in every sample. Mark recommends 30kg SO₃/ha for every 100kg of nitrogen (N) applied to grazing ground, with 50kg SO₃/ha for first cut silage and 40kg/ha for second cut. Fertiliser application rates should be calculated according to its analysis.
“Sulphur is key to nitrogen use efficiency, grass yield and its quality,” he says. “Studies have shown yield improvements of 10-30%, with the highest responses in silage crops. Sulphur can also reduce nitrate leaching.”
Sodium (Na) was low across the platform. Corrective options include applying salt to grazing fields and providing rock salt to the herd.
“The key reason for applying salt on some of the pastures is the excess potash,” explains Mark. “Applying salt helps counteract this problem, which can cause metabolic disorders in cattle.”
Balancing slurry and fertiliser
The review found slurry was both overapplied in some areas and underused in others. Analysing slurry nutrient content allows applications to be matched more accurately to crop requirements, improving nutrient use efficiency and reducing reliance on bought-in fertiliser.
On lower fertility grazing fields, the plan recommended targeted slurry applications to supply valuable nitrogen, phosphate and potash, allowing fertiliser inputs to be reduced while maintaining grass yields. In contrast, higher fertility fields required less additional phosphate and potash, with applications focused mainly on nitrogen and sulphur.
For silage ground, slurry was targeted ahead of cuts where it could deliver the greatest benefit, with fertiliser used to balance remaining nutrient requirements. Mark advised that slurry applications should be carefully managed, as excessive rates can smother crops, restrict soil aeration and increase nutrient losses.
“At 6% dry matter, 33m³/ha of slurry supplies around 33kg/ha of available nitrogen, providing scope to reduce bought-in fertiliser,” says Mark.
Improving soil condition
Healthy, productive soils need aerobic conditions, but compaction creates the opposite effect. Mark recommends digging inspection holes in each field to identify the depth of compaction and whether spike aeration or subsoiling is required.
“Removing compaction improves nutrient cycling and nitrogen use efficiency to the extent that yield and quality could be maintained with 20% less purchased nitrogen,” he says.
For Grasslands Farming Ltd, the nutrient review has provided a clear roadmap to improve soil health, make better use of home-produced slurry and target fertiliser applications more accurately. As part of the UK-DCN, the farm will continue to monitor the impact of these changes, demonstrating how improved nutrient management can deliver both environmental and financial benefits within a grazing-based dairy system.
Table 1: Soil analysis of individual fields across the milking platform.
Field name | pH | CEC | Ca ppm | Ca% | Mg ppm | Mg % | K ppm | K % | Na ppm | Na % |
1. Lt Joss | 6.2 | 14.1 | 1839 | 65.21 | 227 | 13.42 | 231 | 4.20 | 27.00 | 0.83 |
2. Bakers | 6.1 | 11.9 | 1556 | 65.38 | 155 | 10.85 | 184 | 3.96 | 23.00 | 0.84 |
3. TJs | 5.8 | 12.7 | 1534 | 60.39 | 128 | 8.40 | 134 | 2.71 | 23.00 | 0.79 |
4. Roadside | 6.3 | 13.1 | 1879 | 71.72 | 117 | 7.44 | 112 | 2.19 | 22.00 | 0.73 |
5. Front Pasture | 6.6 | 17.4 | 2537 | 72.90 | 112 | 5.36 | 133 | 1.96 | 19.00 | 0.47 |
6. Back P Bott | 6 | 12.8 | 1662 | 64.92 | 177 | 11.52 | 233 | 4.67 | 23.00 | 0.78 |
7. Back P Top | 5.9 | 13 | 1488 | 57.23 | 168 | 10.77 | 230 | 4.54 | 21.00 | 0.70 |
8. Yard 1 | 6 | 11.8 | 1532 | 64.92 | 158 | 11.16 | 178 | 3.87 | 18.00 | 0.66 |
9. Yard 2 | 6.0 | 12.2 | 1587 | 65.04 | 175 | 11.95 | 157 | 3.30 | 23.00 | 0.82 |
10. Henbury Bank | 6.0 | 11 | 1440 | 65.45 | 125 | 9.47 | 148 | 3.45 | 18.00 | 0.71 |
11. Bott Pinch Far | 6.0 | 12.8 | 1753 | 68.48 | 157 | 10.22 | 120 | 2.40 | 21.00 | 0.71 |
12. Bott Pinch Near | 6.3 | 15.1 | 2157 | 71.42 | 189 | 10.43 | 121 | 2.05 | 24.00 | 0.69 |